Strands Powertools Observability
Production-ready observability for Strands Agents on AWS Lambda — X-Ray subsegments per tool call, structured reasoning logs with correlation IDs, and per-tool CloudWatch metrics using Lambda Powertools.
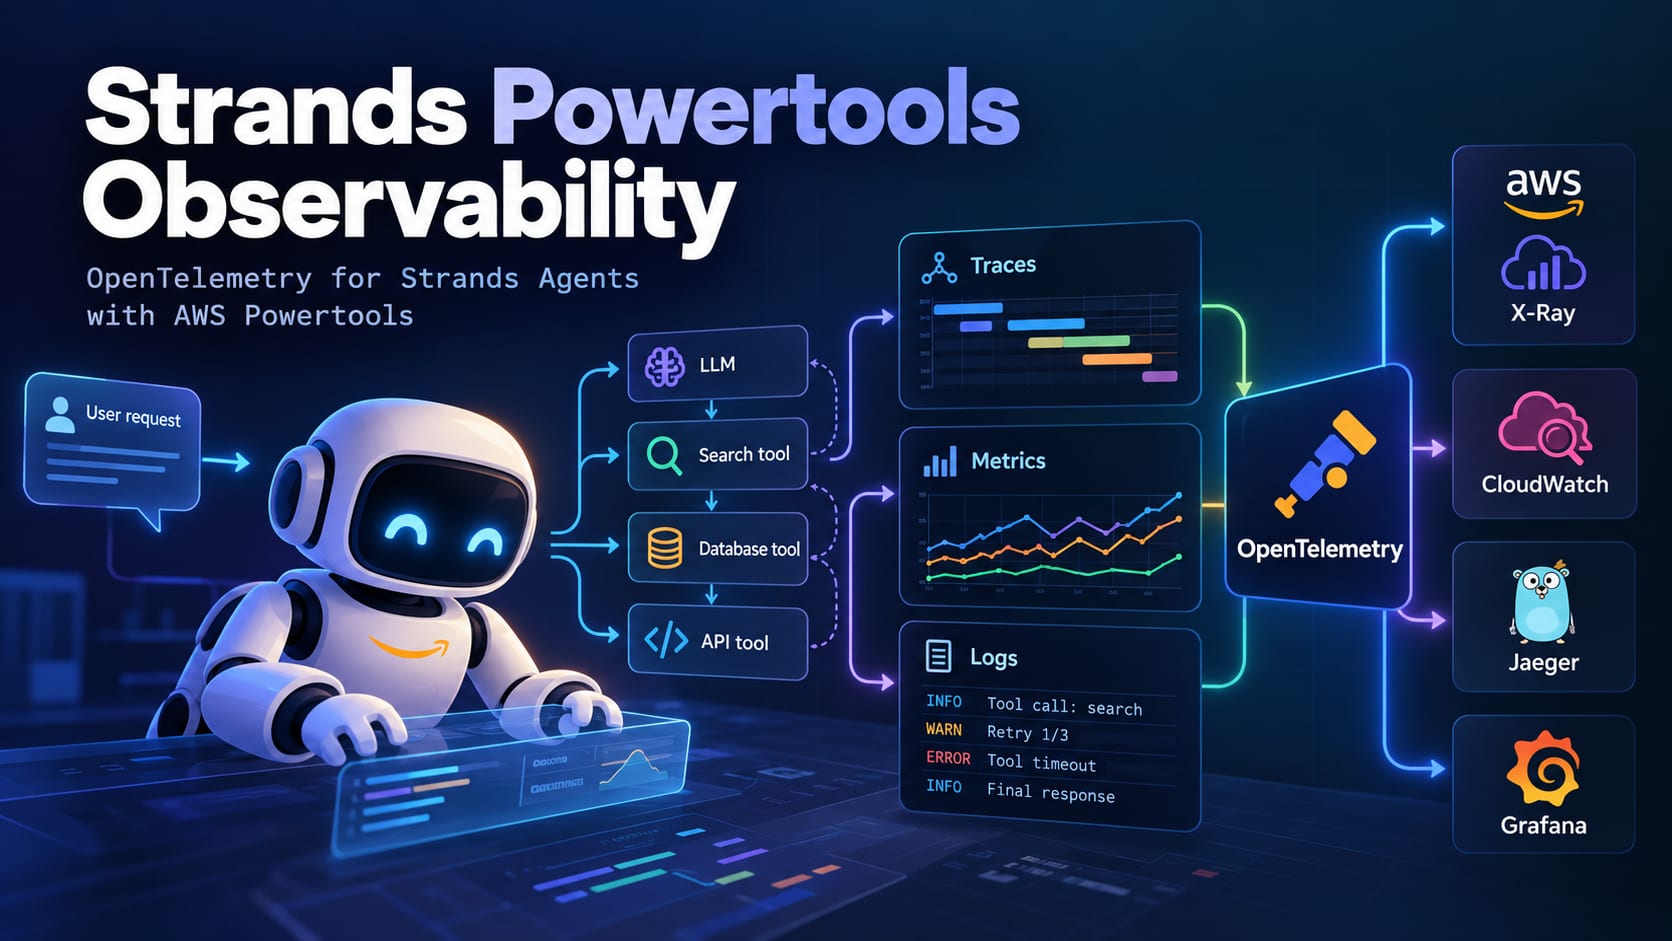
Strands Powertools Observability
Recently, I came across an interesting project for adding observability to Amazon Strands Agents: strands-powertools-observability.
I decided to take the original project by Allexandere as a starting point and build on top of the ideas and approach used there.
The goal is fairly straightforward: make it easier to understand what an AI agent is actually doing during execution.
Why do we need this?
Observability for traditional backend applications is relatively well understood.
You usually want to know:
- which request failed;
- which service is slow;
- where an exception occurred;
- how long a database query took.
AI agents introduce another layer of complexity.
An agent can call an LLM, decide to use a tool, inspect the result, call another tool, retry an operation, or get stuck repeating the same action.
A simple log such as:
Agent execution failed
doesn't tell us much.
For an agent, we want to understand the entire execution flow:
User request
    ↓
LLM
    ↓
Search tool
    ↓
LLM
    ↓
Database tool
    ↓
LLM
    ↓
Search tool
    ↓
Final response
This is where agent-specific observability becomes useful.
Built on top of Strands observability
One of the important architectural decisions in the original project is that it does not try to replace the existing observability mechanisms in Strands.
Strands Agents already provides OpenTelemetry instrumentation and creates spans for operations such as:
invoke_agent;chat;execute_tool;- model calls;
- tool execution.
Instead of creating another parallel tracing system, the project uses the existing telemetry and adds additional information on top of it.
Conceptually:
                Strands Agent
                      │
                      ▼
             OpenTelemetry
                      │
          ┌───────────┴───────────┐
          │                       │
    Existing spans        Additional layer
                                  │
                         ┌────────┼────────┐
                         ▼        ▼        ▼
                      Metrics    Logs    Agent insights
This approach avoids duplicating spans and keeps the observability stack relatively simple.
Tool-level metrics
One of the main features is monitoring individual tool calls.
For example, we can track:
- number of calls;
- execution duration;
- errors;
- retries;
- timeouts;
- repeated calls.
This becomes particularly useful when an agent has a large number of tools.
Instead of simply knowing that an agent became slower, we can investigate which particular tool is responsible for the increased latency.
Agent timeline
Another useful concept is an agent execution timeline.
Traditional applications often have a relatively predictable execution path:
Request → Database → API → Response
An AI agent is different.
The execution path is often decided dynamically by the model:
Request
   ↓
LLM
   ↓
Search
   ↓
LLM
   ↓
Database
   ↓
LLM
   ↓
Search
   ↓
LLM
   ↓
Response
Being able to reconstruct this sequence makes debugging much easier.
Instead of looking at isolated logs, we can see the sequence of actions that led to the final result.
Detecting reasoning loops
One of the more interesting ideas is detecting repeated tool calls.
An agent can sometimes get stuck doing something like:
search("customer")
       ↓
search("customer")
       ↓
search("customer")
       ↓
search("customer")
       ↓
...
Every individual call may be technically successful.
However, from the perspective of the entire agent execution, this can indicate that the agent is no longer making progress.
The project can detect repeated calls to the same tool with the same arguments and treat them as a potential reasoning loop.
This is particularly relevant for production systems because these loops can result in:
- unnecessary token usage;
- increased latency;
- additional API calls;
- higher infrastructure costs;
- failed or incomplete tasks.
Structured logs
The project also provides structured logging that can be correlated with traces.
Instead of having a generic log:
ERROR: Tool failed
we can have additional context:
trace_id: abc123
agent: customer-support
tool: search_orders
duration_ms: 1840
error: timeout
The important part is the relationship between logs and traces.
Once we have a trace_id, we can move from an individual log entry to the complete execution trace and inspect what happened before and after the failure.
OpenTelemetry
The project is built around OpenTelemetry, which means that telemetry doesn't have to be tied to a single observability vendor.
Depending on the deployment, telemetry can be sent to systems such as:
- AWS X-Ray;
- CloudWatch;
- Jaeger;
- Grafana;
- Honeycomb;
- Datadog;
- other OpenTelemetry-compatible backends.
The general architecture looks like this:
                 Strands Agent
                      │
                      ▼
                OpenTelemetry
                      │
        ┌─────────────┼─────────────┐
        ▼             ▼             ▼
      Traces        Metrics        Logs
        │             │             │
        └─────────────┼─────────────┘
                      ▼
             Observability backend
This separation between instrumentation and visualization is one of the main benefits of using OpenTelemetry.
AWS Lambda
The project is also particularly relevant for applications running Strands Agents inside AWS Lambda.
A typical architecture might look like:
API Gateway
     ↓
AWS Lambda
     ↓
Strands Agent
     ↓
LLM
     ↓
Tools
     ↓
OpenTelemetry
     ↓
Observability backend
This makes it possible to inspect agent execution without building a completely separate monitoring system specifically for the AI layer.
Integration
The integration is intentionally lightweight.
For example:
from strands import Agent
from strands_otel import StrandsOtelHooks

agent = Agent(
    tools=[...],
    hooks=[StrandsOtelHooks()],
)
Alternatively, the instrumentation can be enabled globally:
from strands_otel import StrandsOtelInstrumentor

StrandsOtelInstrumentor().instrument()
The exact setup will depend on the application's OpenTelemetry configuration and deployment environment.
Why I find this approach interesting
The interesting part isn't simply adding more traces.
OpenTelemetry itself is already becoming a standard approach for observability in AI applications.
The more interesting question is what we actually want to observe in an autonomous agent.
For a traditional backend service, we might ask:
Where did the request fail?
For an AI agent, we also need to ask:
What did the agent try to do?
Which tools did it use?
How many times did it call them?
Did it retry?
Did it get stuck in a loop?
Which operation caused the latency?
How many steps were required to complete the task?
These are behavioral questions rather than just infrastructure questions.
That is why I think agent-specific observability is becoming an important part of building production AI systems.
Based on an existing project
It is worth explicitly mentioning that this work is not an entirely new implementation from scratch.
I used Allexandere's strands-powertools-observability project as the starting point and built on the ideas and architecture established in the original repository.
The original project was useful as a foundation for exploring how Strands telemetry, OpenTelemetry, metrics, structured logs, and agent-specific signals can work together.
So, credit where credit is due: the underlying idea and initial implementation came from the original author. My work builds upon that foundation rather than presenting it as an entirely original concept.
Final thoughts
As AI agents become more complex, observability needs to evolve with them.
It is no longer enough to know that an LLM request succeeded or that a Lambda function returned an error.
We need to understand the execution process of the agent itself:
Tools
  ↓
Retries
  ↓
Errors
  ↓
Latency
  ↓
Loops
  ↓
Timeline
  ↓
Logs
  ↓
Traces
This is the direction I find particularly interesting about projects like strands-powertools-observability: treating the agent's execution path as something that should be observable, measurable, and debuggable just like any other production system.
Original project: